
Dietary restrictions are often treated like edge cases: a special request, a small exception, or one diner asking for something different.
That framing misses the real problem.
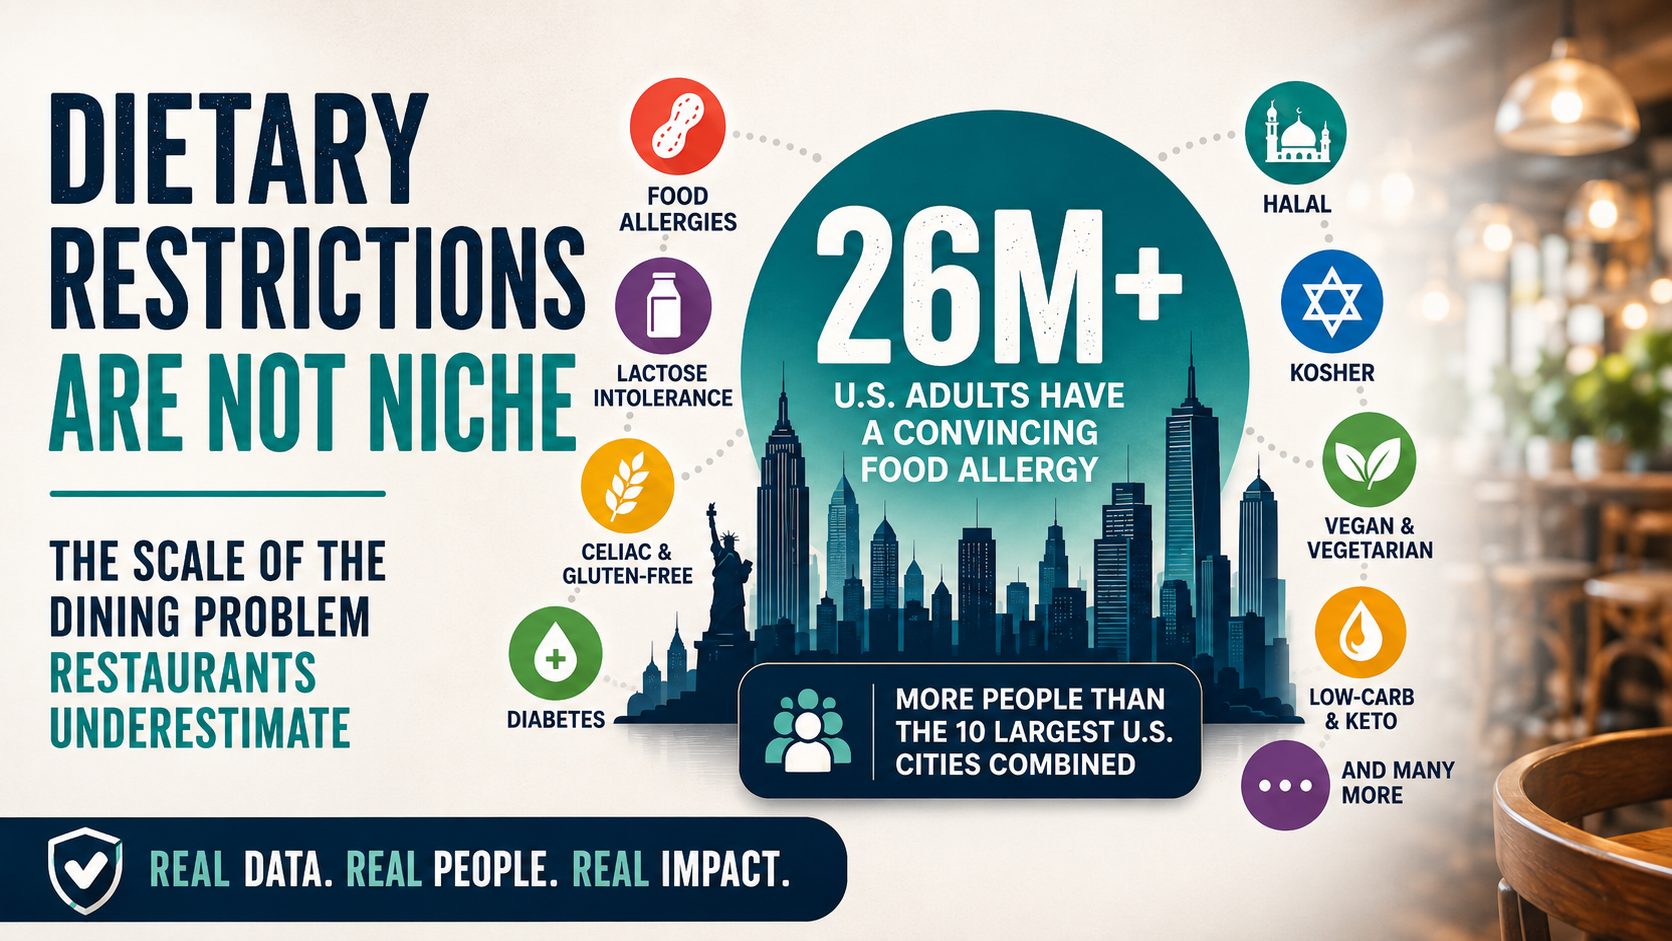
Food allergies, lactose intolerance, celiac disease, diabetes, halal, kosher, vegan, vegetarian, gluten-free, low-carb, keto, and other dietary needs affect a large share of everyday diners. Some needs are medical. Some are religious. Some are ethical, digestive, health-related, or personal.
Restaurants do not have to treat every request the same way. A severe food allergy is not the same as a preference. Celiac disease is not the same as choosing gluten-free. Halal and kosher needs are not simply ingredient preferences.
But restaurants do need to understand that dietary needs are common, varied, and often overlapping. Most menus were not designed to answer that level of detail.
Why Small Percentages Matter
A number like 1%, 3%, or 5% can sound small.
In a large population, it is not small.
It can mean hundreds of thousands or millions of people. It can also affect group decisions, because one person with a serious restriction can shape where an entire table eats.
That is why a dietary need does not have to affect the majority of diners to matter. It only has to appear often enough that restaurants encounter it repeatedly.
Large numbers can be difficult to picture, so it helps to compare several dietary needs side by side.
These figures should not be added together. Some categories overlap, some measure medical conditions while others describe eating patterns, and several are calculated estimates rather than directly measured national counts.
Diabetes is the largest category in this comparison, affecting about 40.1 million people in the United States. An older federal estimate placed symptomatic lactose intolerance at roughly 30 million to 50 million U.S. adults, while current NIDDK guidance separately estimates that 36% of people in the U.S. have lactose malabsorption. Those are not interchangeable measurements: not everyone with lactose malabsorption develops symptoms.
Food allergies affect millions more, and individual allergies such as shellfish, milk, or peanut allergy are large enough to matter on their own. Celiac disease is smaller by comparison, but it still affects about 2 million people in the U.S. and can require strict gluten avoidance.
The gluten-free, low-carb, vegetarian, vegan, halal, and kosher rows are calculated estimates based on survey percentages and population estimates. They are labeled as estimates because the underlying surveys measure different populations and behaviors.
Sources: NICHD lactose intolerance fact sheet, NIDDK lactose intolerance facts, CDC National Diabetes Statistics Report, JAMA Network Open adult food allergy study, NIDDK celiac disease facts, IFIC 2025 Food & Health Survey, Gallup vegetarian and vegan poll, ISPU halal preferences analysis, Pew 2017 U.S. Muslim population estimate, Pew Jewish practices and customs, and Pew Jewish population estimates.
The Data Is Not All Measured the Same Way
The figures are useful, but they are not identical measurements.
Food allergy data may come from diagnosis, self-report, or reported symptoms that are consistent with an allergy. Celiac disease is an autoimmune condition. Lactose malabsorption is not the same thing as symptomatic lactose intolerance.
Religious dietary demand is also difficult to infer from population size alone, because religious affiliation does not reveal exactly how someone eats. Vegan, vegetarian, gluten-free, low-carb, and keto patterns may be measured as identities, preferences, or diets followed during a certain period.
The chart therefore uses three kinds of figures:
- published national counts, such as diabetes and celiac disease;
- study estimates, such as adult food-allergy counts;
- calculated estimates, created by applying a survey percentage to the relevant surveyed population.
The goal is not to combine every number into one total or treat every row as directly comparable.
The goal is to show the range and scale of needs restaurants are being asked to support.
The Scale at a Glance
| Dietary need | What the data shows | Why it matters for restaurants |
|---|---|---|
| Food allergies in the U.S. | CDC/NCHS reported that in 2024, 6.7% of U.S. adults and 5.3% of children had a diagnosed food allergy. A JAMA Network Open study estimated that 10.8% of U.S. adults, or more than 26 million adults, had at least one convincing food allergy based on reported symptoms, while nearly 19% believed they had one. | Food allergy is common enough that restaurants should expect to serve allergic diners regularly. |
| Specific adult food allergies | The JAMA study estimated adult allergy prevalence at 2.9% shellfish, 1.9% milk, 1.8% peanut, 1.2% tree nut, and 0.9% fin fish. That represented about 7.2 million adults with shellfish allergy, 4.7 million with milk allergy, 4.5 million with peanut allergy, 3 million with tree nut allergy, and 2.2 million with fin fish allergy. | Percentages may look modest, but the affected populations are large. |
| Multiple food allergies | Among food-allergic adults in the JAMA study, 45.3% were allergic to multiple foods. | Many diners do not need one allergen filter. They need several. |
| Food allergies in Canada | Health Canada reported 6.1% probable food allergy and 9.3% perceived food allergy across all ages in 2016. | Canadian restaurants also serve a large allergy-aware population, and Canadian allergen frameworks differ from U.S. frameworks. |
| Lactose intolerance and malabsorption | An older NICHD estimate placed symptomatic lactose intolerance at 30 million to 50 million U.S. adults. NIDDK currently reports that about 36% of people in the U.S. and about 68% worldwide have lactose malabsorption, while stressing that not everyone with malabsorption has symptoms. | Dairy-related needs are common, but diners differ in symptoms, tolerance, and how strictly they avoid lactose or dairy. |
| Celiac disease | NIDDK estimates about 2 million people in the U.S. have celiac disease, and about 1% of people worldwide have it. | Celiac disease can require strict gluten avoidance, including attention to preparation and cross-contact. |
| Gluten-free eating | IFIC’s 2025 Food & Health Survey found 7% of U.S. consumers ages 18 to 80 reported following a gluten-free eating pattern in the past year. The chart converts that percentage into an approximate count and labels it as a calculated estimate. | Gluten-free demand includes people with celiac disease, gluten sensitivity, wheat allergy, and people avoiding gluten for other reasons. Those are not the same need. |
| Diabetes | CDC estimated 40.1 million people in the U.S. had diagnosed or undiagnosed diabetes in 2023, or 12% of the population. Canada reports around 3.9 million people over age one living with diagnosed diabetes, or 9.7% of the population. | Diners managing blood sugar may need more useful information than vague labels such as “sugar-free” or “low carb.” |
| Low-carb and keto | IFIC’s 2025 survey found 7% of U.S. consumers ages 18 to 80 reported following a low-carb eating pattern and 5% reported following a ketogenic or high-fat eating pattern in the past year. The chart converts the low-carb percentage into an approximate count and labels it as a calculated estimate. | Restaurants may need to clarify carbohydrates, sugar, substitutions, sauces, and portions. |
| Vegetarian and vegan | Gallup found 4% of U.S. adults identify as vegetarian and 1% as vegan. IFIC’s 2025 survey found 3% vegetarian, 3% plant-based, and 1% vegan among eating patterns followed in the past year. The chart’s million-person figures are calculated estimates based on adult survey percentages. | These groups may be minorities, but they still influence where groups choose to eat. |
| Halal | ISPU found that 83% of U.S. Muslims either require halal certification or prefer halal-certified products when certification is relevant. The chart’s estimate uses that percentage with Pew’s 2017 estimate of 2.15 million U.S. Muslim adults, producing about 1.8 million adults. This is a dated calculated estimate, not a direct current count of halal diners. | Religious dietary needs are tied to sincerely held beliefs, not merely taste or preference. |
| Kosher | Pew found 17% of U.S. Jewish adults keep kosher at home. Applying that percentage to Pew’s estimate of 5.8 million Jewish adults in 2020 produces approximately 1 million adults. This is a calculated estimate and does not measure all forms of kosher observance or restaurant behavior. | Kosher demand cannot be understood from population size alone. Observance varies, and verification matters. |
| Jhatka and Sikh-related dietary needs | Statistics Canada reported about 770,000 Sikhs in Canada in 2021, or 2.1% of the population. Public data on jhatka observance specifically is harder to find. | Some dietary needs are real but poorly captured in mainstream restaurant data. Lack of easy data does not mean lack of demand. |
Sources: CDC/NCHS allergy data, JAMA Network Open adult food allergy study, Health Canada food allergy prevalence, NICHD lactose intolerance fact sheet, NIDDK lactose intolerance facts, NIDDK celiac disease facts, CDC National Diabetes Statistics Report, Public Health Agency of Canada diabetes overview, IFIC 2025 Food & Health Survey, Gallup vegetarian and vegan poll, ISPU halal preferences analysis, Pew 2017 U.S. Muslim population estimate, Pew Jewish practices and customs, Pew Jewish population estimates, and Statistics Canada 2021 religion data.
Inside adult food allergy alone, the largest categories still reach millions of diners.
The food-allergy rows in this chart come from the same U.S. adult study, so they are more directly comparable with one another than the mixed categories in the first chart. Celiac disease is included only as a comparison point; it is an autoimmune condition, not a food allergy.
The Stakes Are Not the Same for Every Diner
A menu label can look simple from the restaurant side. For the diner, its meaning depends on the need.
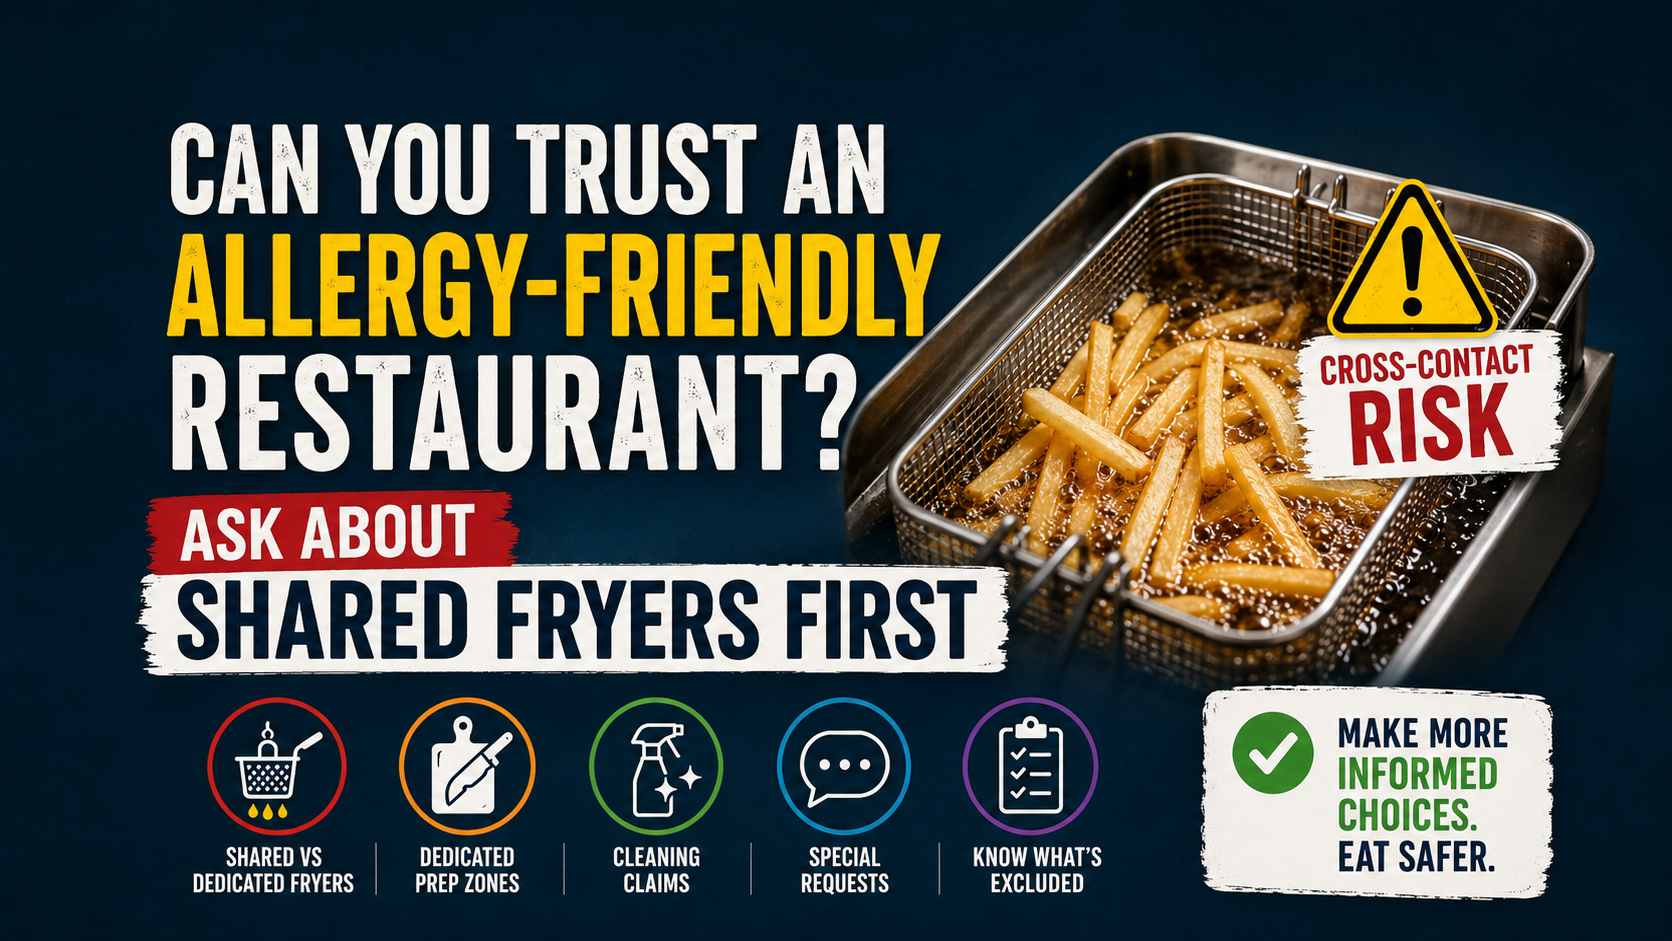
A severe food allergy may require avoiding an ingredient entirely, including cross-contact from shared fryers, preparation surfaces, sauces, oils, toppings, or utensils.
Celiac disease can also require strict gluten avoidance, not just choosing an item without bread.
A diner managing diabetes may care less about a broad “healthy” label and more about carbohydrates, sugar, sauces, portions, and substitutions.
A halal or kosher diner may need information about sourcing, certification, alcohol, preparation, supervision, or shared equipment.
A vegan diner may need to know about animal-derived ingredients while also possibly managing separate allergies or intolerances.
The same label can therefore mean different things depending on who is reading it.
For a more personal look at food-allergy anxiety, read Dining Out With Food Allergies Shouldn’t Be a Gamble.
The Real Problem Is Overlap
Restaurants often organize food information one category at a time: gluten-free, vegan, dairy-free, nut-free, halal, or low-carb.
That helps, but it does not match how people actually eat.
Someone may need halal food and peanut-free options. Someone with celiac disease may also avoid dairy. A vegan diner may also be allergic to soy or sesame. A family may need one restaurant that works for allergies, diabetes, and vegetarian eating at the same meal.
The strongest data point on overlap comes from food allergies: in the JAMA Network Open adult food allergy study, 45.3% of food-allergic adults were allergic to multiple foods.
Source: JAMA Network Open adult food allergy study
Public data is weaker for cross-category combinations, such as people who are both halal-observant and peanut-allergic, or both vegan and soy-allergic. But restaurants serve real people, not clean data categories.
For a practical guide to this problem, read How to Find Restaurants When You Have Multiple Dietary Restrictions.
Why Single-Category Tools Only Solve Part of the Problem
Single-category resources can be useful.
A gluten-free guide can help someone looking for gluten-free options. A vegan directory can help someone find plant-based restaurants. A halal guide can help someone find halal food. An allergy tool can help someone think through allergens.
But real dining decisions often cross those boundaries.
The question is rarely just, “Is there one vegan option?” or “Is there one gluten-free item?”
It is more often, “Can this restaurant support the combination of needs at this table?”
That is where many menus and discovery tools fall short.
Simpa is built around that overlap, with filters for allergies, intolerances, religious food needs, vegan and vegetarian diets, gluten-free eating, low-carb preferences, and other restrictions that often appear together.
One Person Can Shape the Whole Table
Dietary restrictions are bigger than individual prevalence because dining is social.
A group of six people does not need six people with restrictions for the restriction to matter. One person with a serious allergy, one person who eats halal, one person with celiac disease, one vegan diner, or one person managing diabetes can influence where the whole group feels comfortable eating.
For restaurants, clearer food information can help more than the individual diner. It can make the restaurant easier to choose for the entire table.
What This Means for Restaurants
Restaurants do not have to solve every dietary need perfectly for every person.
But they do need to reduce guesswork.
That can mean clearer allergen information, better preparation notes, more consistent terminology, transparent sourcing, useful nutrition details, and honest limits about what the kitchen can and cannot accommodate.
The goal is not to promise safety when safety cannot be guaranteed.
The goal is to make the decision less opaque before someone orders.